Project details
Online School BI
Data platform for education
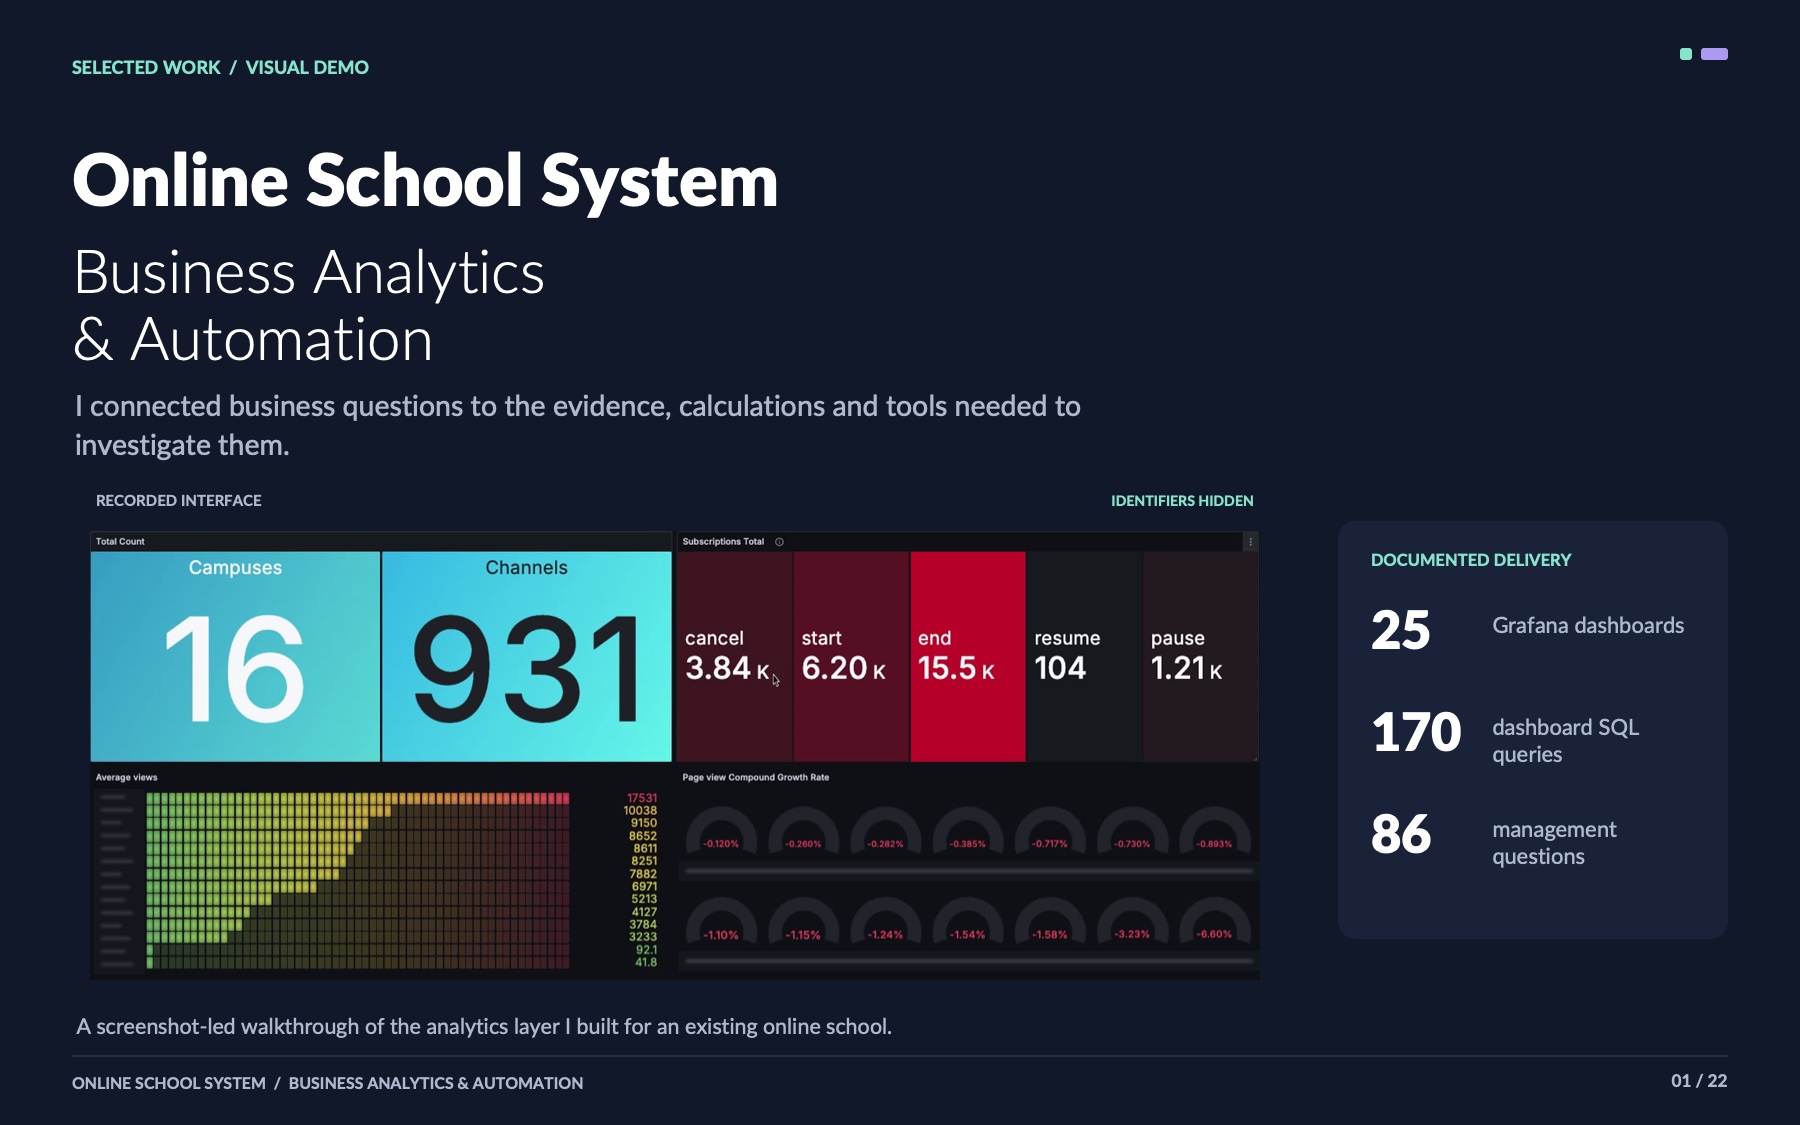
An analytics and automation system connecting learning behavior, community participation, subscriptions and geography. The main contribution was defining meaningful calculations and filters to answer business questions, rather than displaying basic totals.
Delivered 25 Grafana dashboards, 170 dashboard SQL queries, automated data processing, an internal operating workbench, metric definitions and guides for managers and teachers.
- 25 Grafana dashboards
- 170 dashboard SQL queries
- Automated data processing
- Metric definitions and handover
Need something like this in your business?
Nice charts. Now what?
A total tells you how much. A useful dashboard helps you ask why. Connect what people do with what the business needs to know, so the next meeting ends with an action.
Let’s talk about your versionPicture it in...
Fitness memberships
Compare attendance with renewals to spot members who stopped visiting. A friendly check-in could arrive before the cancellation.
Subscription services
Follow sign-ups through first use and renewal. Find where people get stuck, instead of celebrating registrations that go nowhere.